
An Exercise in Docker Swarm – Pt. 2 Load Balancing Grafana with Failover Capabilities
In the last article, we set up a simple Docker Swarm; in this article we will be creating a Grafana server. This server must be able to survive if a node becomes unavailable in the swarm. Additionally it must have one URL to reach it, and data must be persisted.
To begin, let us diagram how the system should look. Remembering our last diagram, seen below, we see that the user is only going to have two nodes and we don’t know which one is going to run the Grafana service.
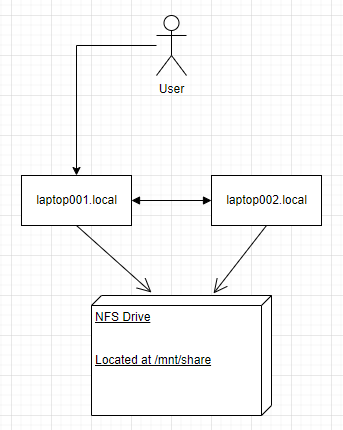
Knowing how Swarm works will help us with our setup; the ingress network setup when you start a stack will allow communication between containers by DNS name thus allowing us to only have to know the name of the container running Grafana. Running Nginx on each node pointing to the Grafana container will automatically load balance the container to where the resources deem best to run the service while simultaneously allowing us to reach Grafana via any node we wish. In this case we will set Nginx on each node to listen on port 80 as it is on a closed network we do not need SSL.
Using Nginx as a load balancer we can point to either node at this point, and in case one node goes down the round robin algorithm will send us to the next node. This allows us to have seamless failover in case of one node going offline; additionally this allows us to bolt on SSL communication.
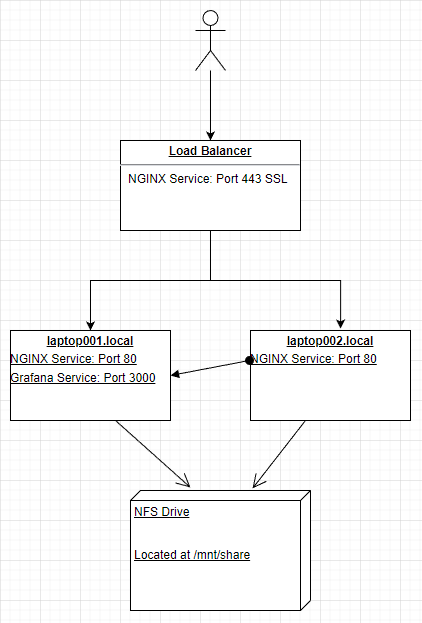
In the diagram we see Grafana on one node, however that is a placeholder as we do not know which node it will actually be on. Now that we have our design, we can begin coding our solution.
On the NFS drive I will place a folder for grafana-data and nginx-data, grafana-data will be a RW mount that Grafana can access and save everything it needs to; nginx-data will be a Read Only mount used for configuring the Nginx services on each node. In the image below, please see the configuration that Nginx will read.
server  {
  listen  80;
  server_name  <target_url>;
  location / {
    proxy_pass http://infrastructure_grafana:3000;
    proxy_set_header Host $http_host;
  }
}
Once we have the configuration set we can prepare our YAML file. We will be using version 3.8 as that is the first version of the compose file that supports Max Replicas per Node.
version: "3.8"
services:
  grafana:
    image: grafana/grafana:latest
    restart: always
    volumes:
      - /mnt/share/grafana-data:/var/lib/grafana
    networks:
      - host

  nginx:
    image: nginx:latest
    restart: always
    depends_on:
      - grafana
    ports:
      - "80:80"
    volumes:
      - /mnt/share/nginx-data/nginx.conf:/etc/nginx/conf.d
    deploy:
      mode: replicated
      replicas: 2
      placement:
        max_replicas_per_node: 1
    networks:
      - host
networks:
  host:
A few things of note in the compose file: the networks, the volumes, replicas, and placement. The networks are important because using just the ingress network that automatically comes with it does not allow the Grafana container to connect to outside data sources, such as the MySQL database behind this website. The Grafana volume is as mentioned earlier, a place for Grafana to write whatever it needs; the Nginx volume is the directory “nginx.conf” that contains the configuration file above. We need to allow the Nginx container to be replicated so that we can run one instance on each node. We have two nodes so we have two replicas. We will allow a maximum of 1 replica per node to ensure proper dispersal of the instances.
Once this is complete we can start up our stack using the command: docker stack deploy --compose-file /mnt/share/docker-compose.yml infrastructure
We can run this from either manager node. Next we need to set up a load balancer to point at both nodes.
upstream grafana {
  server laptop001.local;
  server laptop002.local;
}
server {
  listen  443 ssl;
  server_name  <target_url>;
  ssl_certificate     /etc/letsencrypt/live/<domain>/fullchain.pem;
  ssl_certificate_key /etc/letsencrypt/live/<domain>/privkey.pem;
  location / {
    proxy_pass http://grafana;
    proxy_set_header Host $http_host;
  }
}
In our Nginx configuration for the load balancer we see that the upstream can be either laptop001.local or laptop002.local. By default Nginx uses round robin to determine which host to choose. Thankfully with the backend load balancing of the stack, it will re-load balance to the correct node that is running Grafana.
At this point we can restart our Nginx load balancer and navigate to our Grafana instance. One way to test this is to set one node in the swarm to “drain” by using docker node update --availability drain <node>. This will get all services off of the drained node and onto the other node. Once this is complete you simply need to navigate to the target URL and make sure that it is running. You can also test this the other way by setting the node to “active” and the other node to “drain”.
This concludes the exercise. You should be able to add data sources to Grafana and build pretty graphs if you wish.